Code Impact Analysis for Smarter, Safer AI-Assisted Changes

Code impact analysis gets skipped until an AI edit lands clean in one file and breaks another. You change a type in Cursor, the diff looks fine, then a hidden caller shows up in CI.
What matters is seeing the dependency path before the patch. You need the blast radius, the nearest tests, and the old code you don't want the agent to duplicate.
A few checks save time.
- Find reverse dependencies before the assistant writes code.
- Keep caller fixes separate from cleanup.
- Run the closest tests first, then widen only if the graph says so. Fewer surprises.
Why AI Coding Feels Fast Right Up Until It Breaks Something
You’ve seen this one. You ask Claude Code, Cursor, or Codex to rename a field, add a parameter, or tighten a return type. The patch looks clean. The file compiles. Then CI fails in some other module, or a reviewer points to a caller the agent never saw.
That’s the real tension with AI-assisted coding. The speed is real. So is the low-grade anxiety that comes from not knowing what sits behind the current file.
Teams usually compensate in predictable ways:
- We over-review tiny changes because hidden impact is unclear.
- We run broad test suites because targeted test selection is weak.
- We distrust good AI suggestions because the model doesn’t know the architecture.
- We avoid cleanup because dead code and duplicate paths are hard to verify safely.
Most failures here aren’t about syntax. They aren’t even about bad intent. They come from unseen relationships across the codebase.
That’s the part people miss. A model can write a valid edit and still be wrong about the system.
Safer AI changes come from grounding the model in how the code actually works, not from hoping it can infer the whole architecture from a diff and a few open files.

What Code Impact Analysis Actually Means
Code impact analysis is simple in concept and easy to get wrong in practice. You start from a proposed change and identify what could be affected directly or transitively.
The local edit is just the thing you changed in the file. The impact set is everything tied to that code’s behavior.
A few examples make the distinction clearer:
- You rename
getUserById()in one file. That’s the local edit. - Every caller, wrapper, override, test, and module depending on that symbol is part of the impact set.
- If the function’s return type changes, downstream parsing, validation, and serialization paths may be in scope too.
When people search for code impact analysis, they’re usually asking one of these:
- What breaks if we change this function?
- Who calls this symbol?
- What tests should we run first?
- Is this path actually dead?
- Do we already have existing code somewhere else that solves this?
You’ll also hear adjacent terms that mean roughly the same job from different angles:
- Change impact analysis for codebases focuses on consequences across a real system.
- Software change impact mapping focuses on making those relationships visible as a graph instead of a flat list.
- Engineering blast radius analysis frames the work around risk, review, and deployment safety.
Good impact analysis works at more than one level.
Where impact shows up
- Symbol level - functions, methods, classes, interfaces
- File and module level - imports, packages, build units
- Repository or service level - cross-repo dependencies, shared libraries
- Adjacent artifacts - tests, configs, generated code, sometimes runtime wiring
If your analysis stops at the file you opened, you don’t have impact analysis. You have a nice diff.
Why Plain Diffs, Grep, and Tests Are Not Enough
Diffs are useful. We use them every day. They just answer the wrong first question.
A diff shows what changed. It does not show what the change reaches. Reviewers see syntax first and blast radius second. That order is backwards when AI is making edits quickly.
Grep has the same problem, plus a few more:
- Indirect callers won’t show up in a simple text search.
- Interface implementors can be missed.
- Wrapper layers hide the real path.
- Renames and generated code make text search look more certain than it is.
Tests help, but they’re post-edit signals. They catch regressions after the patch exists. They don’t reliably tell the agent what to inspect before making the edit. And broad test runs buy confidence slowly and expensively.
We’ve seen teams burn 30 minutes of CI time to validate a change that needed 3 targeted test folders and 2 caller updates. That’s not caution. That’s missing context.
Most review and CI workflows catch impact after the fact. For AI-assisted changes, that’s backwards.
Without impact analysis, every model output feels a little reckless, even when the local edit is reasonable. That trust gap is expensive.
Why LLMs Alone Still Struggle With Impact Analysis
Large models are good at summarizing code. They are not consistently good at predicting the full impact set of a change without grounded system context.
Recent experiments with GPT-5 and GPT-5-mini on code-change impact analysis showed poor overall performance, even when the models were given the parent commit tree. Adding diff hunks helped a bit, but not much. That lines up with what many teams are already seeing in practice: more prompt detail gives small gains, not reliable system understanding.
The practical lesson is straightforward. Prompting harder is not the same as knowing the codebase.
There are better patterns. One recent two-phase design first expanded candidate scope using dependence and co-change signals, then used model reasoning to refine precision. That setup improved F1 scores a lot over earlier approaches and let users tune for higher precision or higher recall depending on the task.
That tradeoff matters. During a refactor, you may want broader recall. During a fast PR review, you may want tighter precision.
The useful question isn’t whether AI should help with impact analysis. It should. The real question is what context the system needs so the model can help safely.
The Signals That Matter in Change Impact Analysis for Codebases
Not all signals are equal, and none of them are enough on their own. Good change impact analysis for codebases usually combines several.
The main signal types
- Structural dependencies - calls, imports, control flow, data flow
- Semantic relationships - code meaning, naming, similar behavior
- Evolutionary signals - files or symbols that tend to change together
- Runtime signals - observed usage, production paths, dynamic behavior when available
Each signal earns its place for a different reason.
Structural signals are strong for direct and transitive dependencies. If A calls B, and B changes shape, the graph gives you something concrete.
Semantic signals help when related code has no explicit edge. That’s how you find parallel implementations, duplicate business rules, or another validation path three modules away with different names.
Evolutionary signals can catch patterns static analysis won’t surface. If two areas keep changing together over twelve bug-fix commits, that matters. Though commit history lies more often than people admit.
Runtime signals help with dynamic dispatch, reflection, config-driven wiring, and production-only behavior. Static maps are never the whole story in systems like that.
Research has backed up the mixed-signal approach. Combining learned code representations with program dependence graphs improved ranking quality over a simpler baseline across 25 open-source projects. The strongest setup pushed HIT@10 above 81 percent, meaning impacted entities often showed up near the top of the list. In JavaScript, semantic change relations reduced false positives by 9 to 37 percent and cut impact set size by 19 to 91 percent compared with using diff plus control and data dependencies alone.
The operating principle is pretty clear:
Dependency based impact analysis works best when the graph is real, the semantics are useful, and the system ranks likely impact instead of dumping every reachable edge.
How Software Change Impact Mapping Works in Practice
Software change impact mapping is what turns all of that theory into something a developer can act on. The flow is not complicated. The hard part is getting accurate relationships and keeping them fresh.
A basic pipeline looks like this:
- Start from a seed change - a symbol, file, or diff hunk.
- Resolve definitions and references.
- Traverse reverse dependencies to find who depends on that code.
- Expand through transitive relationships for second-order effects.
- Rank results by directness, relation type, and confidence.
File-level mapping is easier to build and often good enough for quick checks. Symbol-level mapping is where this becomes genuinely useful for API changes, signature edits, and safer refactors. A file may import ten things. You usually only changed one.
A useful output for a developer should surface more than “who calls this”:
- direct callers
- transitive callers
- interface implementors
- affected modules or services
- candidate tests
- possible review owners
- dead code or duplicate logic near the change
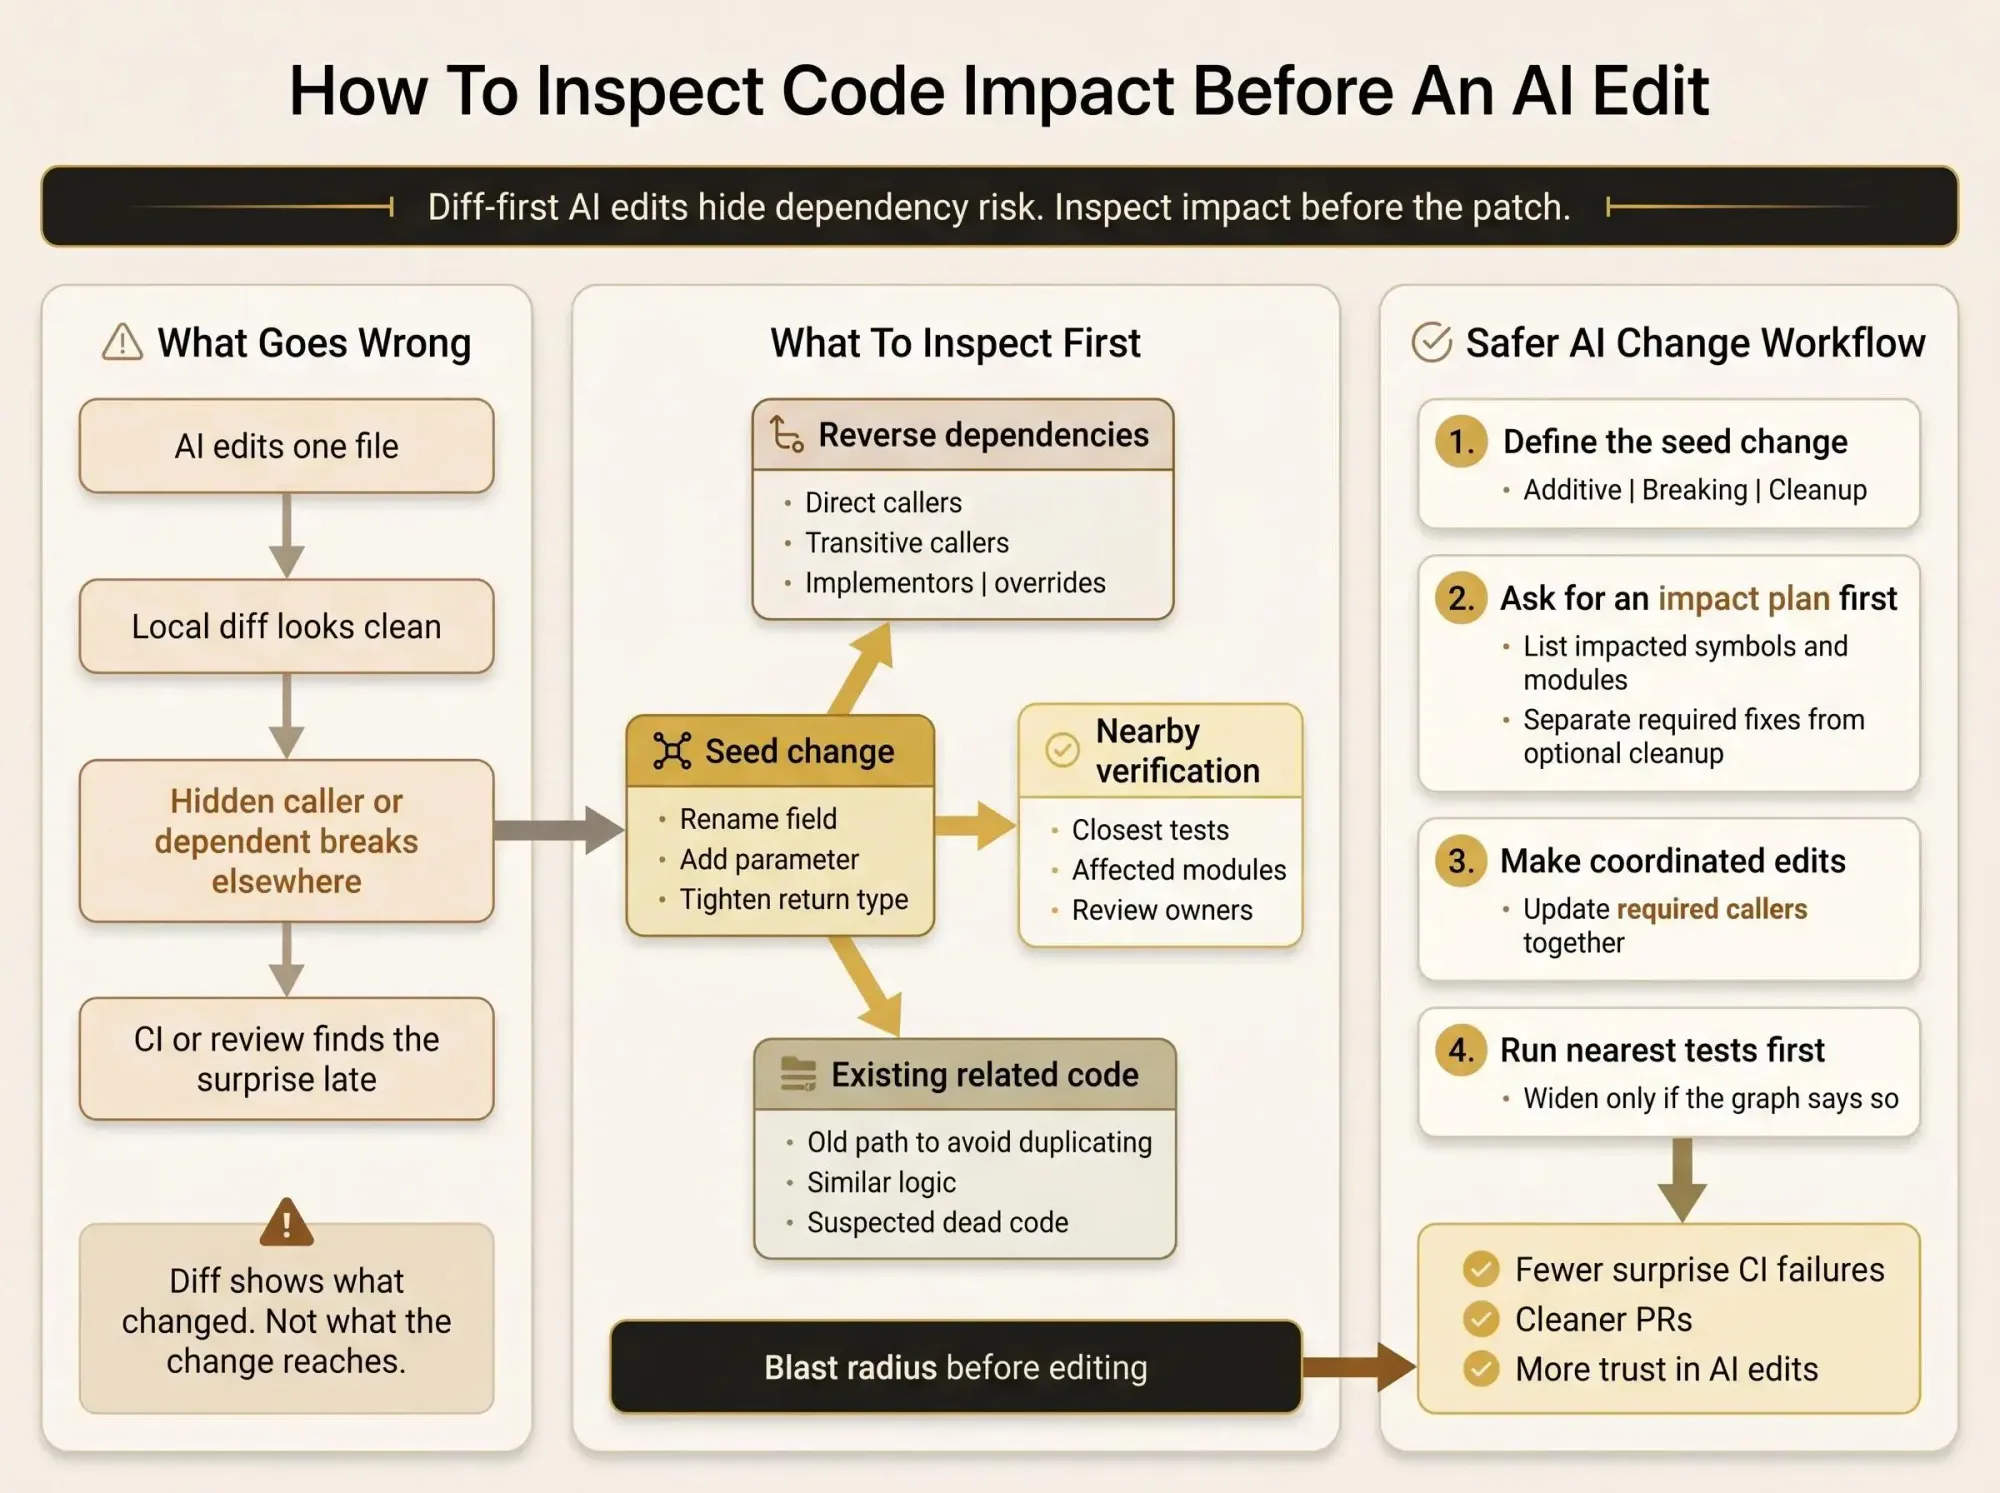
Here’s the practical shift. Instead of treating the repo as disconnected files, you model it as a graph of symbols, modules, services, and relationships. That gives an AI assistant a way to inspect the shape of the system before proposing edits.
That’s also where we think tools should be going. Pharaoh maps software architecture into a knowledge graph so AI coding assistants can see dependencies, blast radius, existing code, and dead code before making changes. In an MCP workflow, that means the assistant can ask for inspectable context during a real session instead of guessing and waiting for CI to object. Pharaoh does this automatically via MCP at pharaoh.so.
What Good Engineering Blast Radius Analysis Gives You
Blast radius analysis is not just a static analysis feature. It’s a decision tool.
Before anyone edits code, it should help answer:
- Is this a small local edit or the start of a broader refactor?
- Do callers, implementors, or tests need updates in the same change?
- Is the risk isolated enough for a quick PR?
- Who should review this because their area sits in the path of impact?
That changes real workflows fast.
In PR reviews, reviewers get context beyond the diff. In refactoring sprints, signature changes stop surprising downstream modules. In monorepo migrations, one shared library update can be scoped before five teams get pulled into cleanup. In AI-assisted dead code cleanup, you can separate truly unreachable paths from code that only looks unused.
We’ve found that once blast radius is visible, teams naturally make smaller, cleaner changes. They stop mixing behavior edits with opportunistic cleanup unless the impact is already clear.
That’s a healthier way to work. Less mystery. Fewer “why did this break over there?” comments on day two.
Impact should be inspectable, not intuitive.
Why Impact Analysis in Monorepos Is Harder Than It Looks
Monorepos make hidden dependencies cheap to create and hard to reason about. Shared libraries collect dependents quietly. Package boundaries often don’t match runtime behavior. Different languages and indexers live in one workspace. Ownership is spread across teams, which means local confidence is often false confidence.
The common failure modes are familiar:
- changing a public type used across many modules
- breaking an interface contract implemented in another package
- touching generated code or wrappers that hide the real dependency path
- shipping the same fix twice because similar logic exists in parallel modules
Good impact analysis in monorepos needs to surface cross-module callers, transitive propagation across package boundaries, and confidence levels for exact references versus weaker inferred relationships. It should also point out similar patterns elsewhere so you can review them together instead of rediscovering them a week later.
There are edge cases too. Notebook-style workflows break normal assumptions because execution can be out of order. Interesting detail: specialized notebook static analysis has shown that most real-world notebooks can still be analyzed quickly. The reminder is useful even if you never touch notebooks. Execution model matters.
If your AI assistant only sees the open file and a local diff, it is not doing impact analysis in a monorepo. It is improvising.
A Practical Workflow for Smarter, Safer AI-Assisted Changes
You can apply this now. No process rewrite required.
1. Define the seed change clearly
Name the symbol, file, contract, or behavior that is changing. Also classify the change:
- additive
- breaking
- cleanup
That small step sharpens everything that follows.
2. Inspect impact before editing
Check:
- direct callers and imports
- transitive dependents
- interface implementors and overrides
- nearby tests, modules, and owners
Don’t open the editor first. Open the map first.
3. Ask the agent for a plan, not just a patch
A better prompt is: list impacted symbols and modules, explain which dependents need edits, separate required changes from optional cleanup, and call out uncertainty where the graph is incomplete.
That one habit changes the whole session.
4. Make the smallest safe set of coordinated edits
Update required callers in one pass. Avoid mixing behavior changes with broad cleanup unless the impact is clear.
Small and coordinated beats clever and scattered.
5. Run targeted verification
Prioritize tests and modules closest to the impact path. Expand test scope only when the blast radius suggests it. If you need broader quality guardrails around linting, testing, and AI review standards, the open source AI Code Quality Framework is a useful companion at github.com/0xUXDesign/ai-code-quality-framework.
6. Review the result against the map
Confirm that impacted symbols were considered. Double-check any supposedly unused path before cleanup.
A common real workflow is a Claude Code session before a function signature change: inspect callers first, ask for a plan, patch all required updates, then run only the closest tests before widening scope if needed. If you’re using an MCP client, a codebase graph can give the assistant this context before it edits, instead of after CI fails.

What to Look for in a Dependency Based Impact Analysis Tool
Don’t shop by feature count. Pick by decision quality.
A useful dependency based impact analysis tool should answer a few hard questions well.
Coverage and precision
- File level only, or symbol level too?
- Exact definitions and references across files?
- First-hop callers only, or real transitive analysis?
Relationship depth
Can it model imports, calls, implementations, overrides, control flow, and data flow as different relationship types? If everything gets flattened into one weak edge, the output gets noisy fast.
Ranking and confidence
Does it prioritize likely impact or just dump every reachable node? Can it show why something is in the impact set? You want ranked reasoning, not graph spam.
Workflow fit
Does it fit the IDE, PR review, refactoring sprint, or MCP session you already use? Extra context no one checks is just another dashboard.
Codebase reality
- monorepo and multi-repo support
- polyglot indexing quality
- stale index handling
- visibility into dead code and duplicate patterns
There are quality tiers here. Basic parsing can identify symbols quickly but often misses accurate cross-file reference resolution. Richer semantic indexing usually gives higher-confidence analysis.
And yes, categories matter. IDE call hierarchy is fine for local checks. Repo search is still useful. Static code graph tools are better. Graph plus semantic ranking is better again. Graph-aware assistants are what start to make AI edits feel grounded instead of lucky.
Common Failure Modes and How to Avoid Them
Impact analysis can fail in ways that look convincing. That’s the dangerous part.
A few to watch closely:
- Diff-only thinking
Mistake: assuming changed lines describe the whole risk.
Fix: inspect reverse dependencies before editing. - Over-wide impact sets
Mistake: treating every structural neighbor as equally relevant.
Fix: rank by relation type, distance, and semantics. - Under-wide impact sets
Mistake: trusting exact graph edges and missing semantically related fallout.
Fix: combine structural and semantic signals where possible. - History blind spots
Mistake: treating co-change as truth when commit history is noisy.
Fix: use history as a supporting signal, not the only one. - Dynamic behavior blind spots
Mistake: assuming static references capture runtime paths.
Fix: flag uncertainty around reflection, dynamic dispatch, config wiring, and generated code. - Stale or partial maps
Mistake: trusting outdated indexing.
Fix: make graph freshness part of the workflow. - Dead code confusion
Mistake: deleting code that looks unused but still has an indirect role.
Fix: verify reachability before cleanup.
One more subtle point. Older impact-analysis benchmarks were often small and tangled by messy commits, which made true performance harder to judge. Cleaner benchmarks based on fine-grained bug-fix commits give a better picture. Measurement quality matters because bad evaluation creates false confidence.
How to Start Using Code Impact Analysis This Week
Start with one change type that already makes your team nervous:
- function signature updates
- shared type changes
- interface edits
- cleanup of suspected dead code
Then add one pre-edit checkpoint. Before the agent writes code, inspect callers, dependents, and likely blast radius.
Change one prompt habit too. Ask the assistant to list impacted symbols and modules first, then propose the patch.
Keep one simple review standard:
Every non-trivial AI-generated change should include a short impact summary.
At the team level, track recurring hidden dependencies that surprise reviewers. Those are signals that your graph or indexing needs work in specific areas, not that the team needs to “be more careful.”
If your team is already using AI coding assistants through MCP, adding a codebase graph is a practical way to reduce guesswork without changing how developers work. Pharaoh is one way to do that at pharaoh.so.
Conclusion
The main shift is simple. Smarter AI-assisted development does not come from asking the model to guess better. It comes from giving it a faithful map of the system so code impact analysis becomes part of the edit, not just the postmortem.
When dependencies, blast radius, existing code, and dead code are visible, teams move faster with less fear and smaller surprise costs. You stop treating architecture as tribal knowledge and start treating it as inspectable context.
Pick one upcoming change this week. Inspect its impact before anyone edits the file. Then compare that with your usual diff-first process.
You’ll feel the difference by the second afternoon.